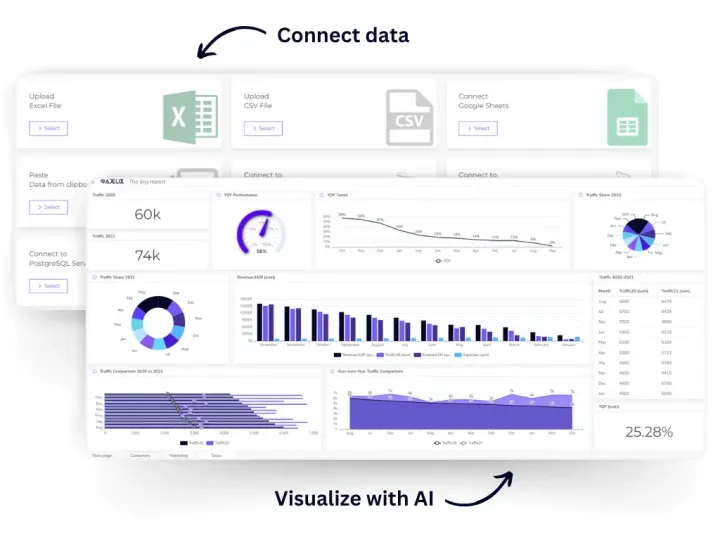
Make a Graph in 3 Simple Steps
Step 1
Upload CSV file
To make a chart you need to upload data
Step 2
Describe your chart
Write a prompt for AI by describing your needs
Step 3
Download PNG
Get a .png of your chart to insert in presentations


Your Data Is Safe
We do not store your data once you exit the browser your data exits with you. Your data is not used for AI/ML module training and is not shared with third parties.
We Empower Non-Technical Teams
Creatives and non-technical teams can finally make graphs without spending tireless hours on spreadsheets.


Share Your Graphs With Stakeholders
Create graphs, track metrics in one dashboard that you can easily share with colleagues.
Real-time data updates
Connect your data with Google Sheets or SQL server

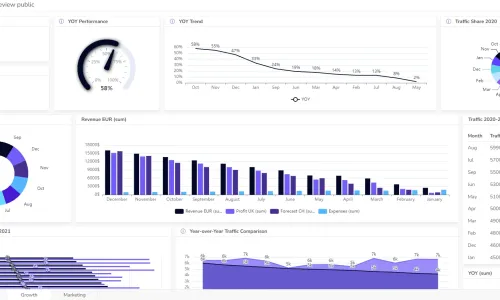
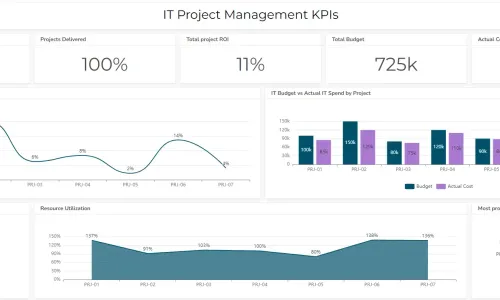
Track KPIs & Metrics
Prepare your data and calculate business critical KPIs

Present Data Like A Pro
Create a dashboard for professional presentation